Current Research Activities - LTER VII
The Arctic is rapidly warming. Some responses to this warming involve acceleration of processes common to other ecosystems around the world (e.g., shifts in plant species), whereas others are unique to the Arctic but with global consequences for society (e.g., carbon loss from permafrost thaw). The objectives of the Arctic Long-Term Ecological Research (ARC-LTER) project for 2023-2029 are to determine how and how fast trends in climate change and especially climate variability are changing arctic ecosystem structure and function.
These objectives will be met through continued long-term monitoring of changes in undisturbed and disturbed ecosystems along the terrestrial to aquatic continuum in the vicinity of Toolik Lake, Alaska. In addition, we measure the recovery of these ecosystems from natural or imposed disturbances and maintain existing long-term experiments.
Through a combination of data analysis and modeling we will assess how climate change and climate variability will affect biogeochemistry and community dynamics of ecosystems, and determine how ecosystem responses will propagate across the landscape.
We have three overarching research questions:
Question 1. How does climate variability affect the openness and connectivity of arctic ecosystems?
Question 2. How does climate variability affect key consumers and their influence on ecosystems?
Question 3. How does climate variability affect carbon dynamics along the terrestrial-aquatic continuum?
These are separate questions but together they integrate our research across the terrestrial-aquatic continuum.
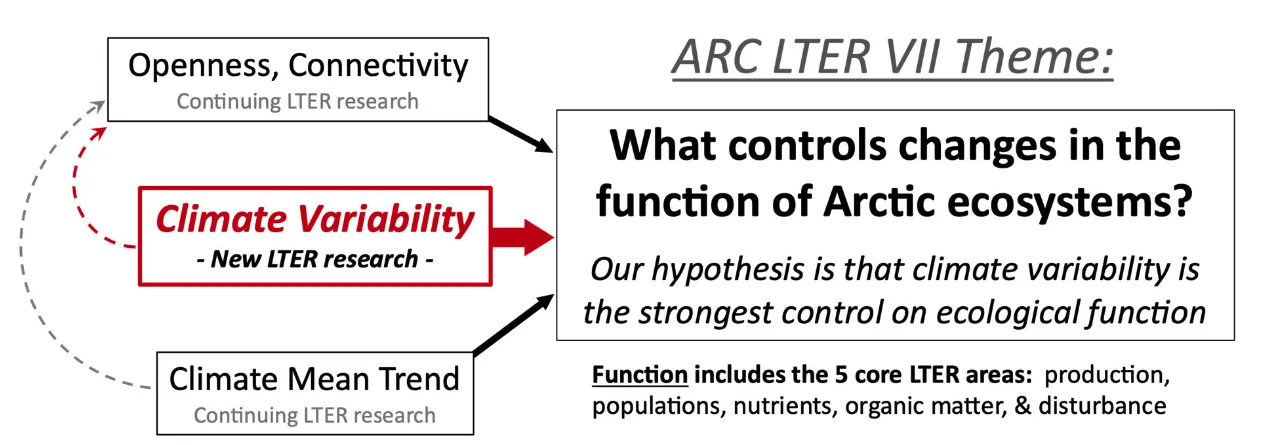
Conceptual diagram, showing our new focus on climate variability (red box, red arrows). Solid lines represent direct effects on ecosystems while dotted lines represent indirect effects on ecosystems. The size of the red arrow is intentional to indicate our hypothesis that climate variability will have the most control.
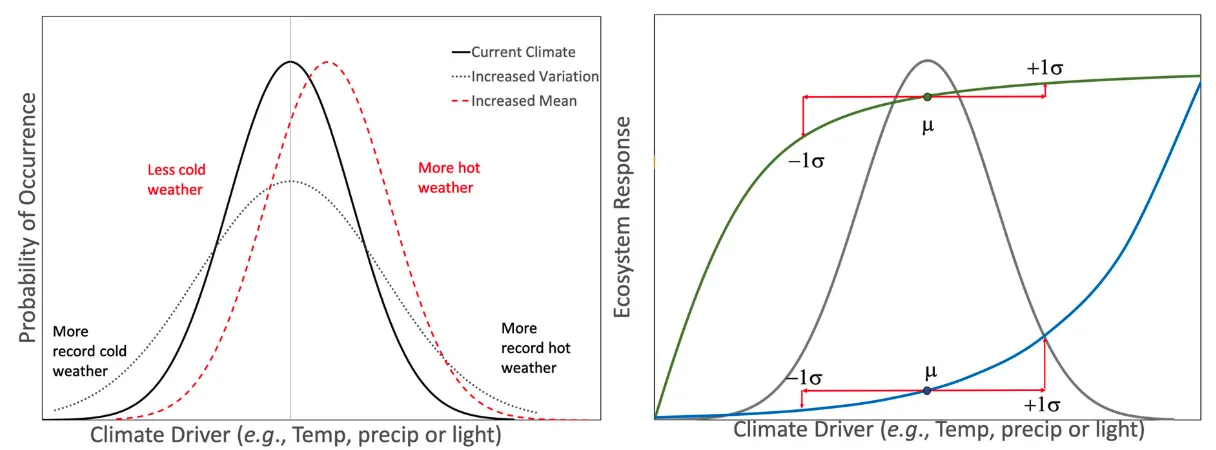
Effects of climate driver distribution on the extremes (left) and non-linear ecosystem responses (right). The left-hand panel compares a shift in the mean (red dashed line, e.g., temperature) to an increase in variability (black dotted line). The right-hand panel shows the same driver distribution (gray curve) and superimposes saturating (green curve) and exponential (blue curve) ecosystem responses. Ecosystem responses at the mean climate driver (m) and at ±1 s are highlighted; note the asymmetry at ±1 s. In both cases the mean ecosystem response from integrating across the distribution is not equal to the ecosystem response at the mean of the climate distribution (Jensen’s inequality). Modified from Thornton et al. 2014 (left) and Rudgers et al. 2018 (right).